
Sydney Councils Aren’t Meeting Targets
Both sides of politics agree we need to set and enforce high housing targets for local councils.
The NSW government announced new targets for councils in May 2024, consistent with a total state target of 75,000 homes a year.
These targets are not being met. In their first six months of operation (to December 2024), the ABS’s Building Approvals in NSW only ran at an annual rate of 45,000.
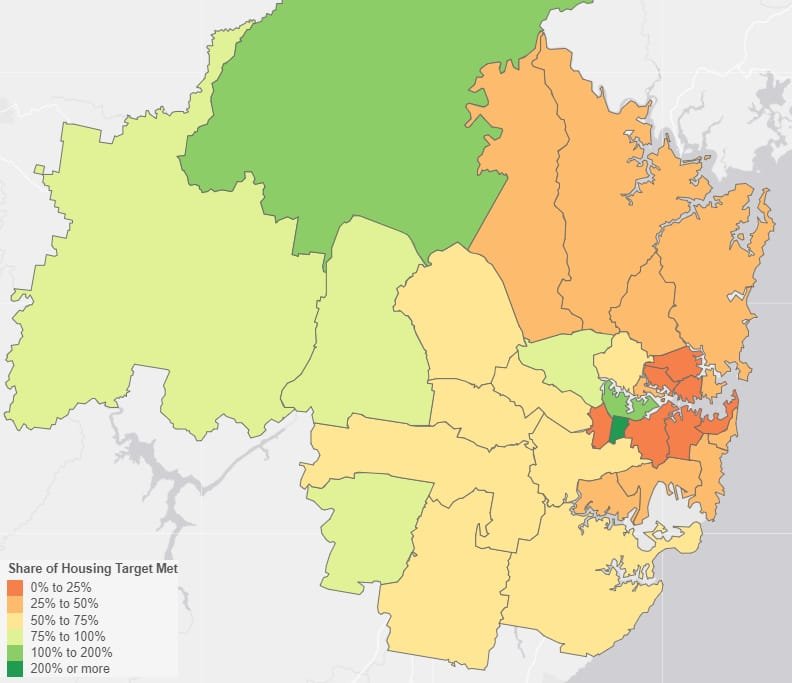
The table below shows housing targets and approvals for 33 local councils in the Greater Sydney area. The map shows approvals as a percentage of targets.
No-one is suggesting that six months is long enough to assess whether councils are succeeding or failing, let alone for any remedial action to be taken. One large block of flats can change the picture, especially for small councils. Moreover, big reforms like the Transport-Oriented Development are still on architects’ drawing boards (though we are starting to see the first Development Applications being lodged).
But it is important that councils know that they are being monitored and that poor performance will be called out.
The worst recent performer has been Lane Cove Council, which is meant to be building 680 homes a year. But in the first six months of the target, only 18 were approved. However, it would be unfair to criticize, as Lane Cove approved almost 600 new dwellings just a few months earlier.
No such excuse can be offered for councils which have been persistent under-performers:
North Sydney council is meant to be building 1,180 homes a year, but it has only been approving them at a rate of 68 a year.
Sydney council is meant to be building 3,780 a year, but has only been approving at a rate of 456 a year.
Both of these councils also fell woefully short of the previous targets set for them by the Greater Sydney Commission. Between 2021 and 2024 North Sydney and Sydney were only approving 27% and 33% of their targets respectively.
Councils need to be told they are on notice and that persistent failure to achieve targets will result in remedial action. An initial remedy might be for local and regional planning panels to take under-performance into account in considering rezoning and development applications. If that isn’t enough, then automatic upzoning and non-refusal standards should follow.
DPHI actively monitors approval times and other measures where high-frequency data is important. League tables are reported here. Georges River is the worst. Minister Paul Scully has told six councils to improve performance. This is very good. However, the main objective is housing supply. It is the level – rather than the speed – of approvals that determines affordability. Approvals and completions, as a percentage of the target, should be added to the league tables.
In the longer run, targets need to be substantially increased for over-priced inner and eastern suburbs. But we should start by monitoring and enforcing the targets we have.
Local Council Building Approvals as Percentage of Housing Target
Greater Sydney; July-December 2024
|
Council Housing Targets and Approvals |
||||||||
|
Council |
Annual Target |
Annualised Approvals |
% of target approved |
Rank |
||||
|
Bayside |
2,020 |
554 |
27% |
8 |
||||
|
Blacktown |
4,280 |
2,980 |
70% |
23 |
||||
|
Blue Mountains |
120 |
114 |
95% |
30 |
||||
|
Burwood |
660 |
2,146 |
325% |
33 |
||||
|
Camden |
2,040 |
1,588 |
78% |
27 |
||||
|
Campbelltown |
2,100 |
1,114 |
53% |
18 |
||||
|
Canada Bay |
1,000 |
1,356 |
136% |
31 |
||||
|
Canterbury-B’town |
2,900 |
1,558 |
54% |
19 |
||||
|
Cumberland |
2,440 |
1,458 |
60% |
21 |
||||
|
Fairfield |
1,180 |
826 |
70% |
24 |
||||
|
Georges River |
1,260 |
452 |
36% |
15 |
||||
|
Hawkesbury |
260 |
362 |
139% |
32 |
||||
|
Hornsby |
1,100 |
392 |
36% |
14 |
||||
|
Hunters Hill |
80 |
26 |
33% |
9 |
||||
|
Inner West |
1,560 |
198 |
13% |
5 |
||||
|
Ku-ring-gai |
1,520 |
524 |
34% |
12 |
||||
|
Lane Cove |
680 |
36 |
5% |
1 |
||||
|
Liverpool |
3,340 |
1,960 |
59% |
20 |
||||
|
Mosman |
100 |
46 |
46% |
17 |
||||
|
North Sydney |
1,180 |
68 |
6% |
2 |
||||
|
Northern Beaches |
1,180 |
394 |
33% |
10 |
||||
|
Parramatta |
3,900 |
3,358 |
86% |
29 |
||||
|
Penrith |
1,680 |
1,258 |
75% |
26 |
||||
|
Randwick |
800 |
270 |
34% |
11 |
||||
|
Ryde |
2,320 |
1,666 |
72% |
25 |
||||
|
Strathfield |
700 |
88 |
13% |
4 |
||||
|
Sutherland Shire |
1,200 |
732 |
61% |
22 |
||||
|
Sydney |
3,780 |
456 |
12% |
3 |
||||
|
The Hills Shire |
4,660 |
2,014 |
43% |
16 |
||||
|
Waverley |
480 |
166 |
35% |
13 |
||||
|
Willoughby |
680 |
108 |
16% |
6 |
||||
|
Wollondilly |
1,100 |
930 |
85% |
28 |
||||
|
Woollahra |
380 |
92 |
24% |
7 |
||||
|
Total |
52,680 |
29,290 |
56% |
|||||